
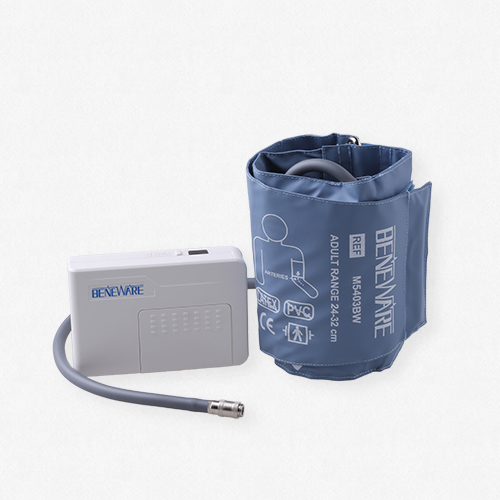
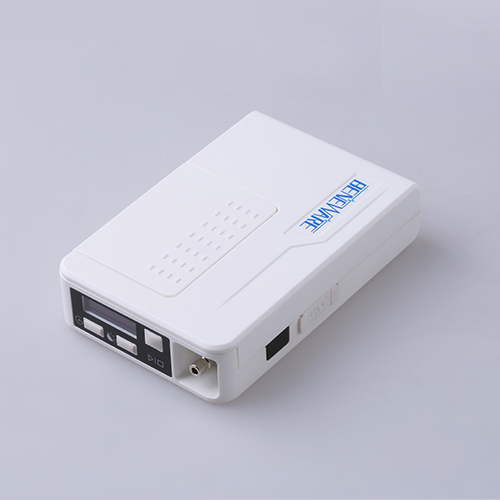
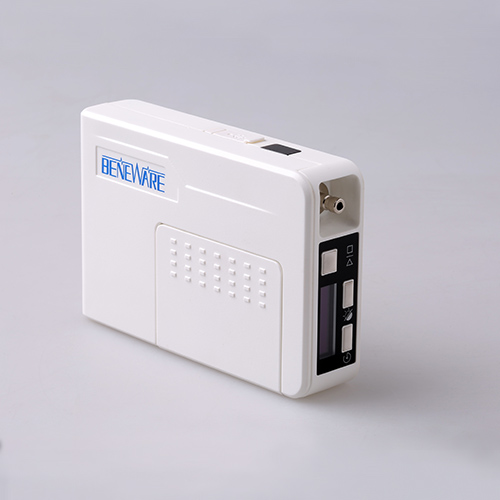
Ambulatory Blood Pressure Monitor
| Name: | Ambulatory Blood Pressure Monitor |
|---|---|
| Interactive Interface: | LCD, Keypad |
| Measurement Range: | SBP: 60~255mmHg; DBP: 30~195mmHg; |
| Accuracy: | Pressure: ±3mmHg; Pulse Rate: ±5 |
| Pulse Rate: | 30~200bpm |
| Reproducibility: | ≤3mmHg |
| Method of Measurement: | Oscillometry with linear deflation |
| Record Capacity: | 200~400 records |
| Data Interface: | USB, bluetooth, IrDA |
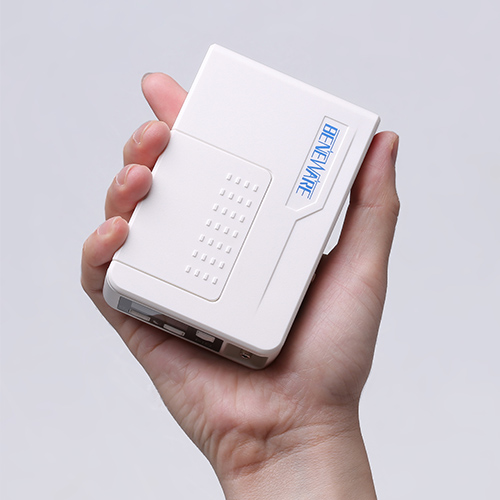
| Monitor Dimension: | 113 x 75 x 26 mm |
| Monitor Weight: | 168g without battery |
| Monitor Ingress Protection: | IP22 |
| Cuff Size: | M5402BW: 20~24cm, M5403BW: 24~32cm, M5404BW: 32~38cm |
| Battery: | Two AA (LR6) alkaline or high capacity Ni-HM batteries |
Product Description
Have no idea about what abpm is? Click here to learn more.
High Lights
Customizable report template
Software Features
Blood pressure (SBP/DBP/MBP)
HR (Heart rate)
NNR (Nocturnal reduction rate)
Morning surge
BP load
STDEV (Standard Deviation)
CV (Coefficient Of Variation)
Patient status (Idle/Arrhythmia/Artifact)
AASI (Ambulatory Arterial Stiffness Index)
Circadian rhythm
Auto interpretation
Medication
Powerful Tools
BP Summary
· Shows the analysis results of blood pressure in the whole day, day and night
· The analysis results include STDEV, CV, Morning BP, BP Load, Nocturnal reduction rate, etc.
Auto interpretation
· Includes morning surge, circadian rhythm, and AASI, etc.
· Provides alarm for White coat hypertension, Masked Hypertension and Low blood pressure.
BP Table
· Records the blood pressure values in each period of time
· Provides ABP pulse waveform display for further diagnosis to assure accuracy
· Shows patient status (Idle/Arrhythmia/Artifact) in every measurement result
Trend Chart
· Reflects the tendency of systolic, diastolic, average pressure, and heart rate in the corresponding time in the list of valid data
Scatter Chart
· Reflects the distribution of systolic and diastolic blood pressure, as well as the distribution of systolic blood pressure and heart rate
· Can be used as a reference to judge atherosclerosis
Histogram Chart
· Reflects the percentage distribution of systolic pressure, diastolic blood pressure, and heart rate in each range interval
Pie Chart
· Reflects the distribution percentage of systolic, diastolic blood pressure, and heart rate in different range situation intuitively
Circadian Chart
· Reflects the hourly changes in blood pressure
· Shows the dangerous period of patient's blood pressure
Print Report
· Allows saving report as PDF.
· Provide template for Homepage Report, which is customizable by the user.

 Send Email
 Vangie Yu